Validating NVIDIA Vera on agentic CPU workloads: 1.64x per core against a leading x86 processor
-
 Ryan Shrout
Most of the time today, every discussion of AI infrastructure starts with the GPU, and for training and inference that is the right place generally. Agentic workflows change the mix however. An agent that writes code, runs it, reads the result and tries again spends much of its time outside the model, compiling, running tests, cloning repositories and moving files. That work runs on the CPU, and the loop it sits in could often be CPU-bound.
CPU execution time limits how quickly an agent returns to the model, and when thousands of sessions run at once that wait is paid per session and per core. In this test we assigned one sandbox to each physical core and kept every core busy, so the comparison is task completion time under full load.
Signal65 built PINNACLE to measure AI platforms on the work enterprises run on them, and the CPU portion of PINNACLE, which covers this class of agentic host work, is in full-speed development now. NVIDIA has been explicit that it treats the CPU as part of the AI platform. Vera is the CPU half of Rubin, NVIDIA is offering it standalone, and its argument is that per-core performance on agentic work is where a CPU earns its place. Over the last week or so we have worked with NVIDIA on Vera to begin to test it.
Background and Goals of the Testing
NVIDIA wanted its internal Vera measurements checked against an x86 server processor, and Signal65 wanted a repeatable test of agent-generated CPU work to fold into the PINNACLE program, so over several weeks the two teams developed the methodology described below.
The test needed to run at full load, with every core on the processor busy the way a fleet host would be. It should measure the whole lifecycle of an agent task, from spinning up the sandbox through running the work and checking the result, because that is the time an agent session waits for. It needed to keep the model out of the loop so the result measured the CPU and not the LLM.
NVIDIA ran bare-metal pairs in its lab that produced the figures in this post. Signal65 reviewed the methodology and the per-task data, had hands-on access to the same Vera system to run the suite ourselves in two configurations, and compared the outcomes task by task. NVIDIA provided hardware access and its measurement data. Signal65 chose what to publish and how to present it. Signal65 also works with AMD and other hardware vendors, and we expect to run the same workloads on their parts under their configurations and in other interesting scenarios in the months ahead.
Building the Test Methodology
The workload had to look like the shell work an agent generates, it had to be verifiable so a run could be scored as pass or fail, and it had to be reproducible across two very different processors. Terminal-Bench 2, an open corpus of 89 tasks that an AI agent is expected to complete in a Linux terminal, met all three. Newer revisions of the suite have shipped since, but this testing uses the 2.0 release that was current when the project started. Each task ships as a container with a starting state, a task description, a hidden test suite that decides pass or fail, and a reference solution, and the Harbor harness that runs the suite builds the container, runs the agent inside it, then runs the tests.
The reference solutions make the suite usable for a CPU comparison. Instead of a model, the harness runs an oracle agent that replays each task’s reference solution as the agent’s commands, so every run executes the same shell work an agent would have produced, with no inference and no variance from the model. What remains is the task lifecycle, which means building and starting the sandbox, executing the solution, running the verifier and tearing the sandbox down.
The CPU tasks look like tickets from a busy engineering team: repair a corrupted git repository, recover a SQLite database from its write-ahead log, configure nginx to log requests a particular way, compile the CompCert C compiler from source, etc. Each one is scripted, verified and timed, and each one exercises the CPU the way an agent might, with many short processes, heavy file and package activity, bursts of compute and a container lifecycle around all of it. The tasks generally fall into five categories by the resource they lean on most.
| Category | Tasks | Examples |
|---|---|---|
| Storage and file-access heavy | 20 | fix-git, db-wal-recovery, sqlite-with-gcov, video-processing, extract-elf |
| Mixed agentic | 12 | cobol-modernization, fix-code-vulnerability, configure-git-webserver, headless-terminal |
| Network and service IO | 9 | nginx-request-logging, kv-store-grpc, openssl-selfsigned-cert, pypi-server |
| Core compute-heavy | 20 | compile-compcert, crack-7z-hash, path-tracing, regex-chess, portfolio-optimization |
| Memory and ML-heavy | 15 | train-fasttext, dna-assembly, hf-model-inference, sam-cell-seg |
Task categories in the 76-task comparison set. Thirteen of the 89 tasks were not in the set, 11 not run and 2 at zero pass on both platforms.
This test measures the sandbox-and-tools portion of an agent workflow, so it excludes model inference and it does not measure whole-server throughput. We plan to add other workload measures through the CPU portion of Signal65 PINNACLE, which is coming soon.
The comparison pairs NVIDIA Vera, with 88 Olympus cores, against an AMD EPYC 9755 (Turin) with 128 cores, each on a single socket on bare metal. Every physical core runs one task sandbox at a time, pinned to that core and its sibling thread, which puts 88 concurrent sandboxes on Vera and 128 on the x86 processor. Every task runs once per core, so each processor is fully loaded and each core sees an identical job.
The measure of merit for each task is elapsed time from sandbox creation to teardown, and we report the slowest copy on each socket, so the figure for a task is the time for the whole batch of copies to finish. The ratio for a task is x86 time divided by Vera time, and we report the geometric mean of those ratios across the 69 matched tasks (the tasks that passed every copy on both processors). The full configuration is in the method table at the end.
Per-core Performance Results Across 69 Agentic Tasks
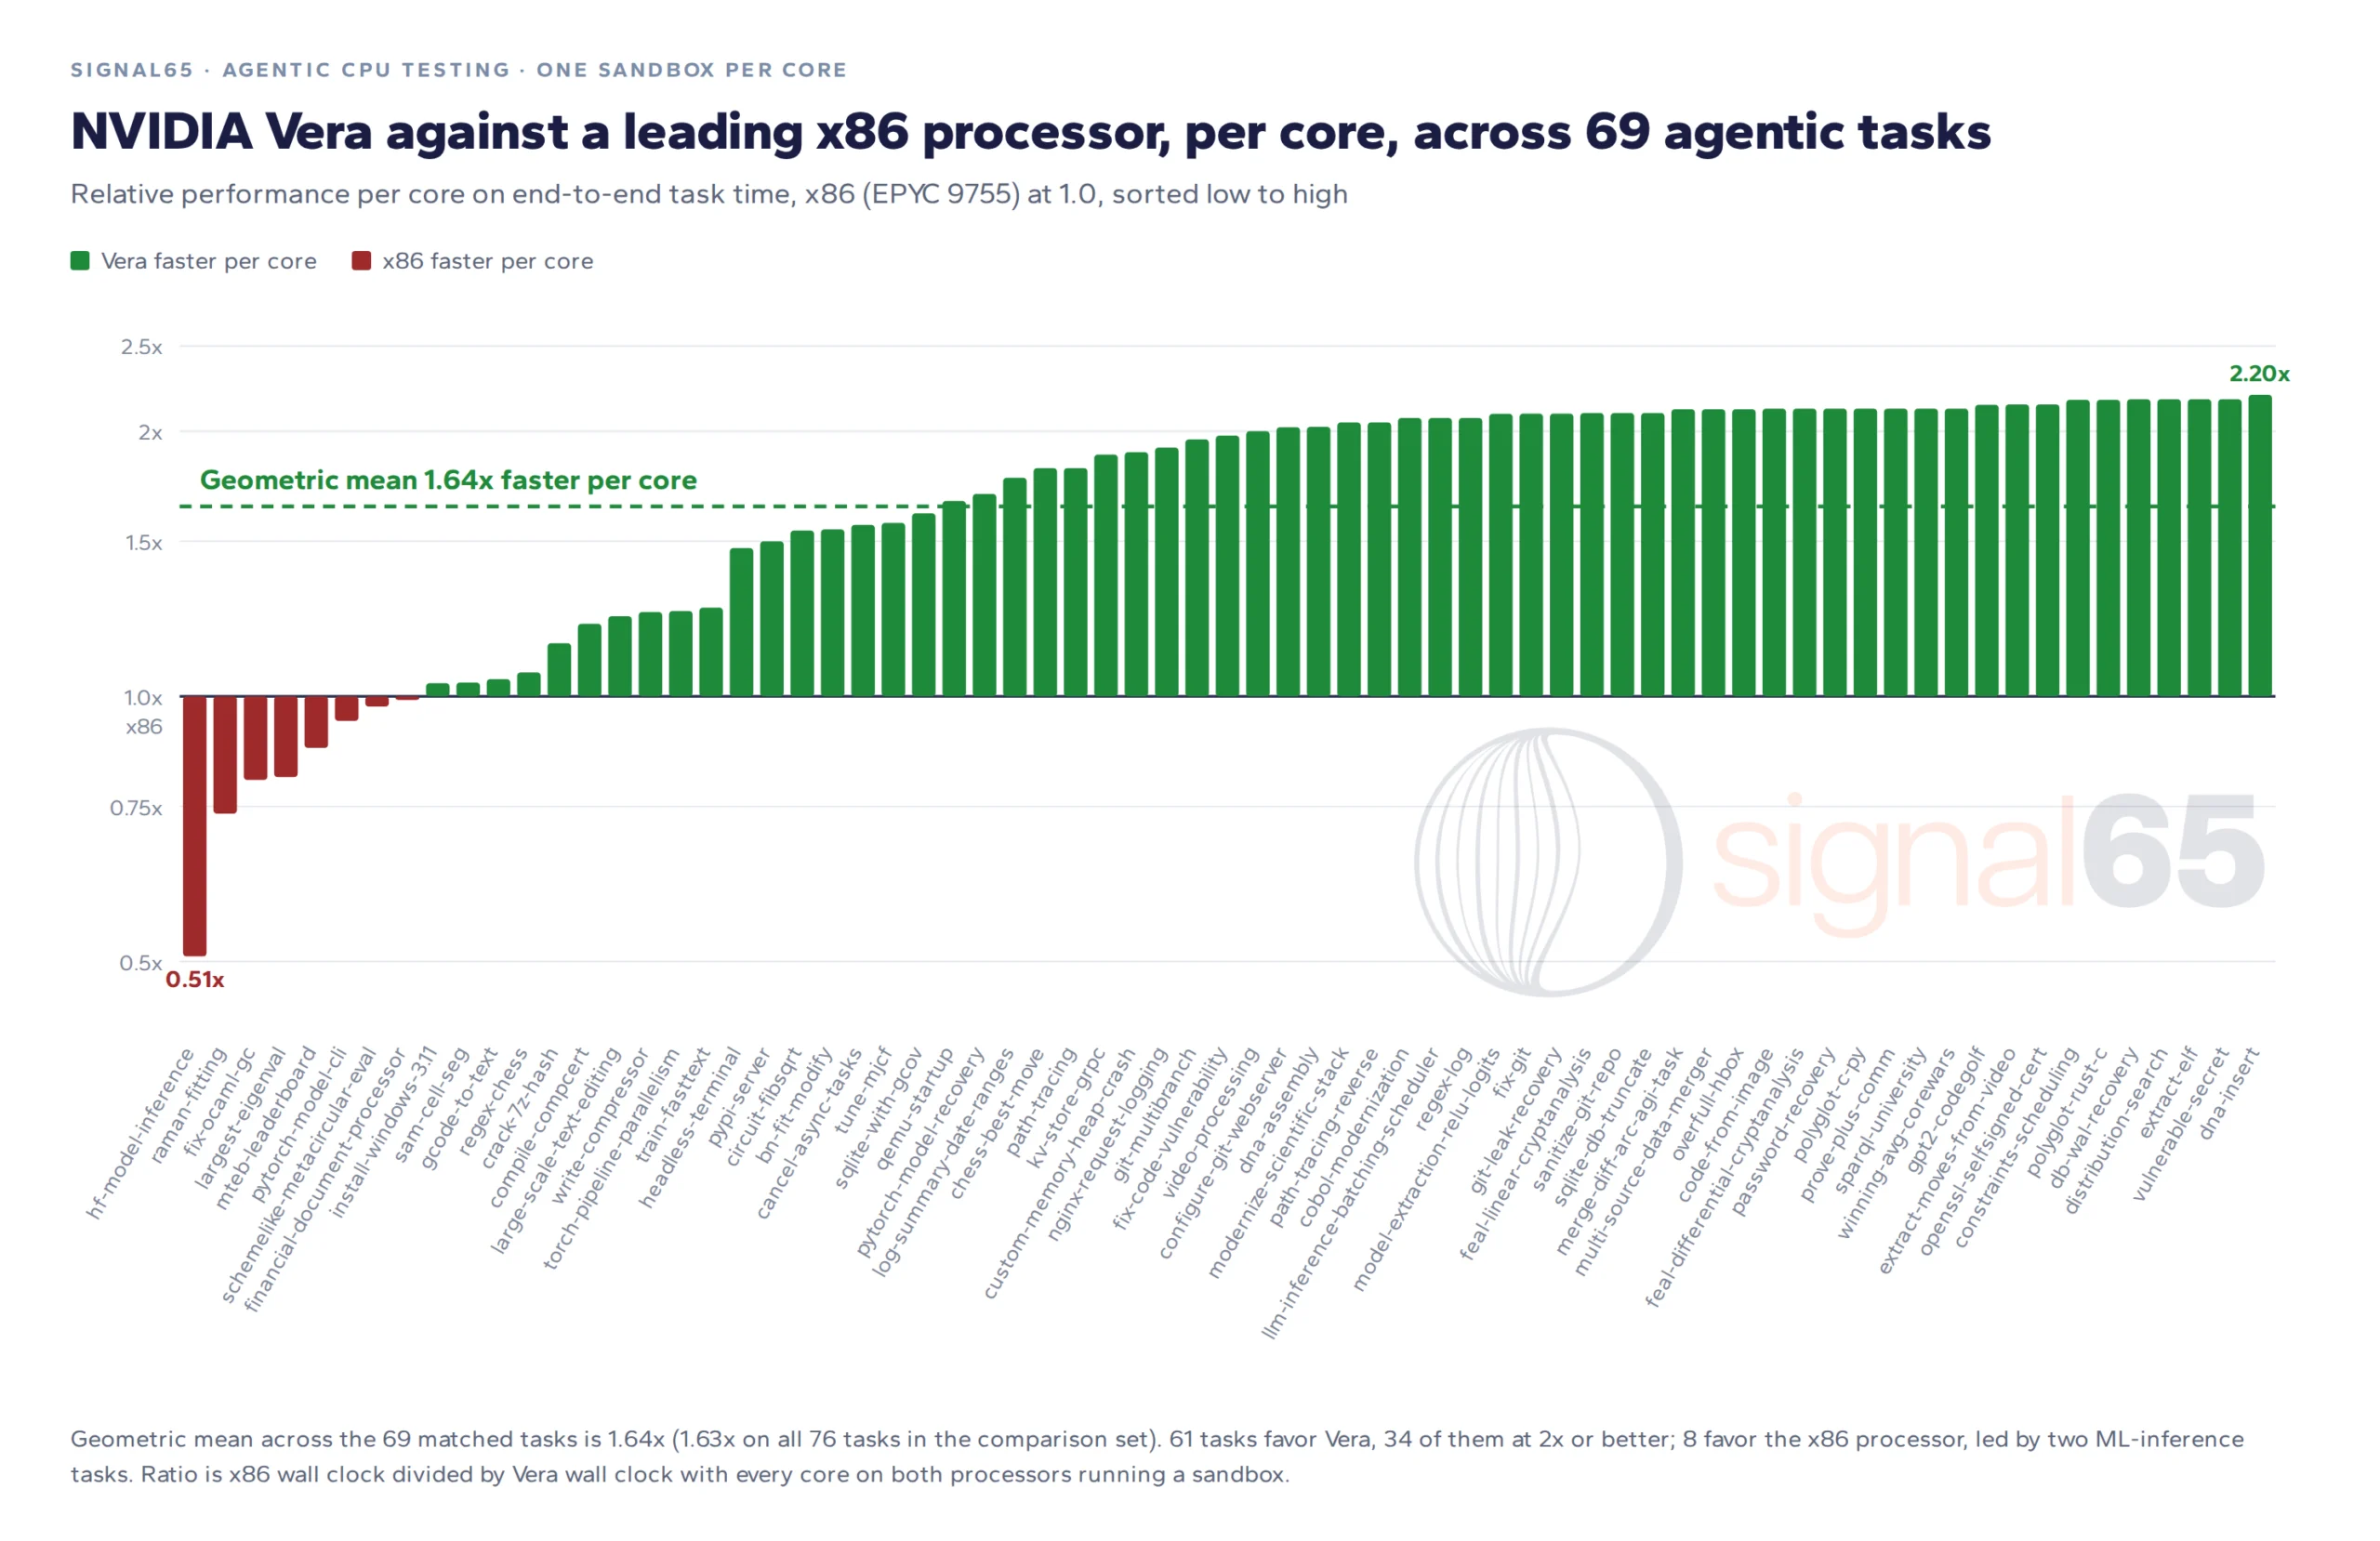
Figure 1. Per-core relative performance across the 69 matched tasks, x86 (EPYC 9755) at 1.0.
With every core on both processors running a sandbox, Vera finished the agentic task lifecycle 1.64x faster per core than the x86 processor, measured as the geometric mean across the 69 matched tasks. On all 76 tasks in the comparison set, including those where one processor did not pass every copy, the figure is 1.63x, so the aggregate ratio is similar for these two task sets.
The advantage is noteworthy, with 61 of the 69 tasks favoring Vera and 34 of them by 2x or more, and the largest leads are often in the mixed agentic tasks that dominate real agent sessions. Eight tasks favor the x86 part, led by hf-model-inference at 0.51x and raman-fitting at 0.74x.
These results compare per-core task completion under full load, and we did not measure whole-server agent throughput. A deployment comparison would also need to account for core count, with 128 cores on the x86 part against 88 on Vera, along with price, power and memory capacity, which the CPU portion of PINNACLE will take up.
Signal65 Hands-on Testing on Vera
Alongside NVIDIA lab runs, Signal65 had hands-on access to the same Vera system and ran the full suite on it, both following NVIDIA’s published run steps as written with task images we built ourselves, then with NVIDIA’s own task images and its full configuration. Both runs produced the pass profile NVIDIA saw, with the same tasks passing and the same tasks failing at the same 88-sandbox load.
On NVIDIA’s configuration our task times came in more than 10% faster than NVIDIA’s own on 56 of 67 comparable tasks, within 10% on eight, and slower on three, which works out to an aggregate speedup of 1.23x. NVIDIA’s reported task times fell between those from our two Vera configurations, and with NVIDIA’s full configuration our Vera run was faster in aggregate. The 1.64x comparison with the x86 processor remains based on NVIDIA’s paired measurements.
Distribution of Per-task Results
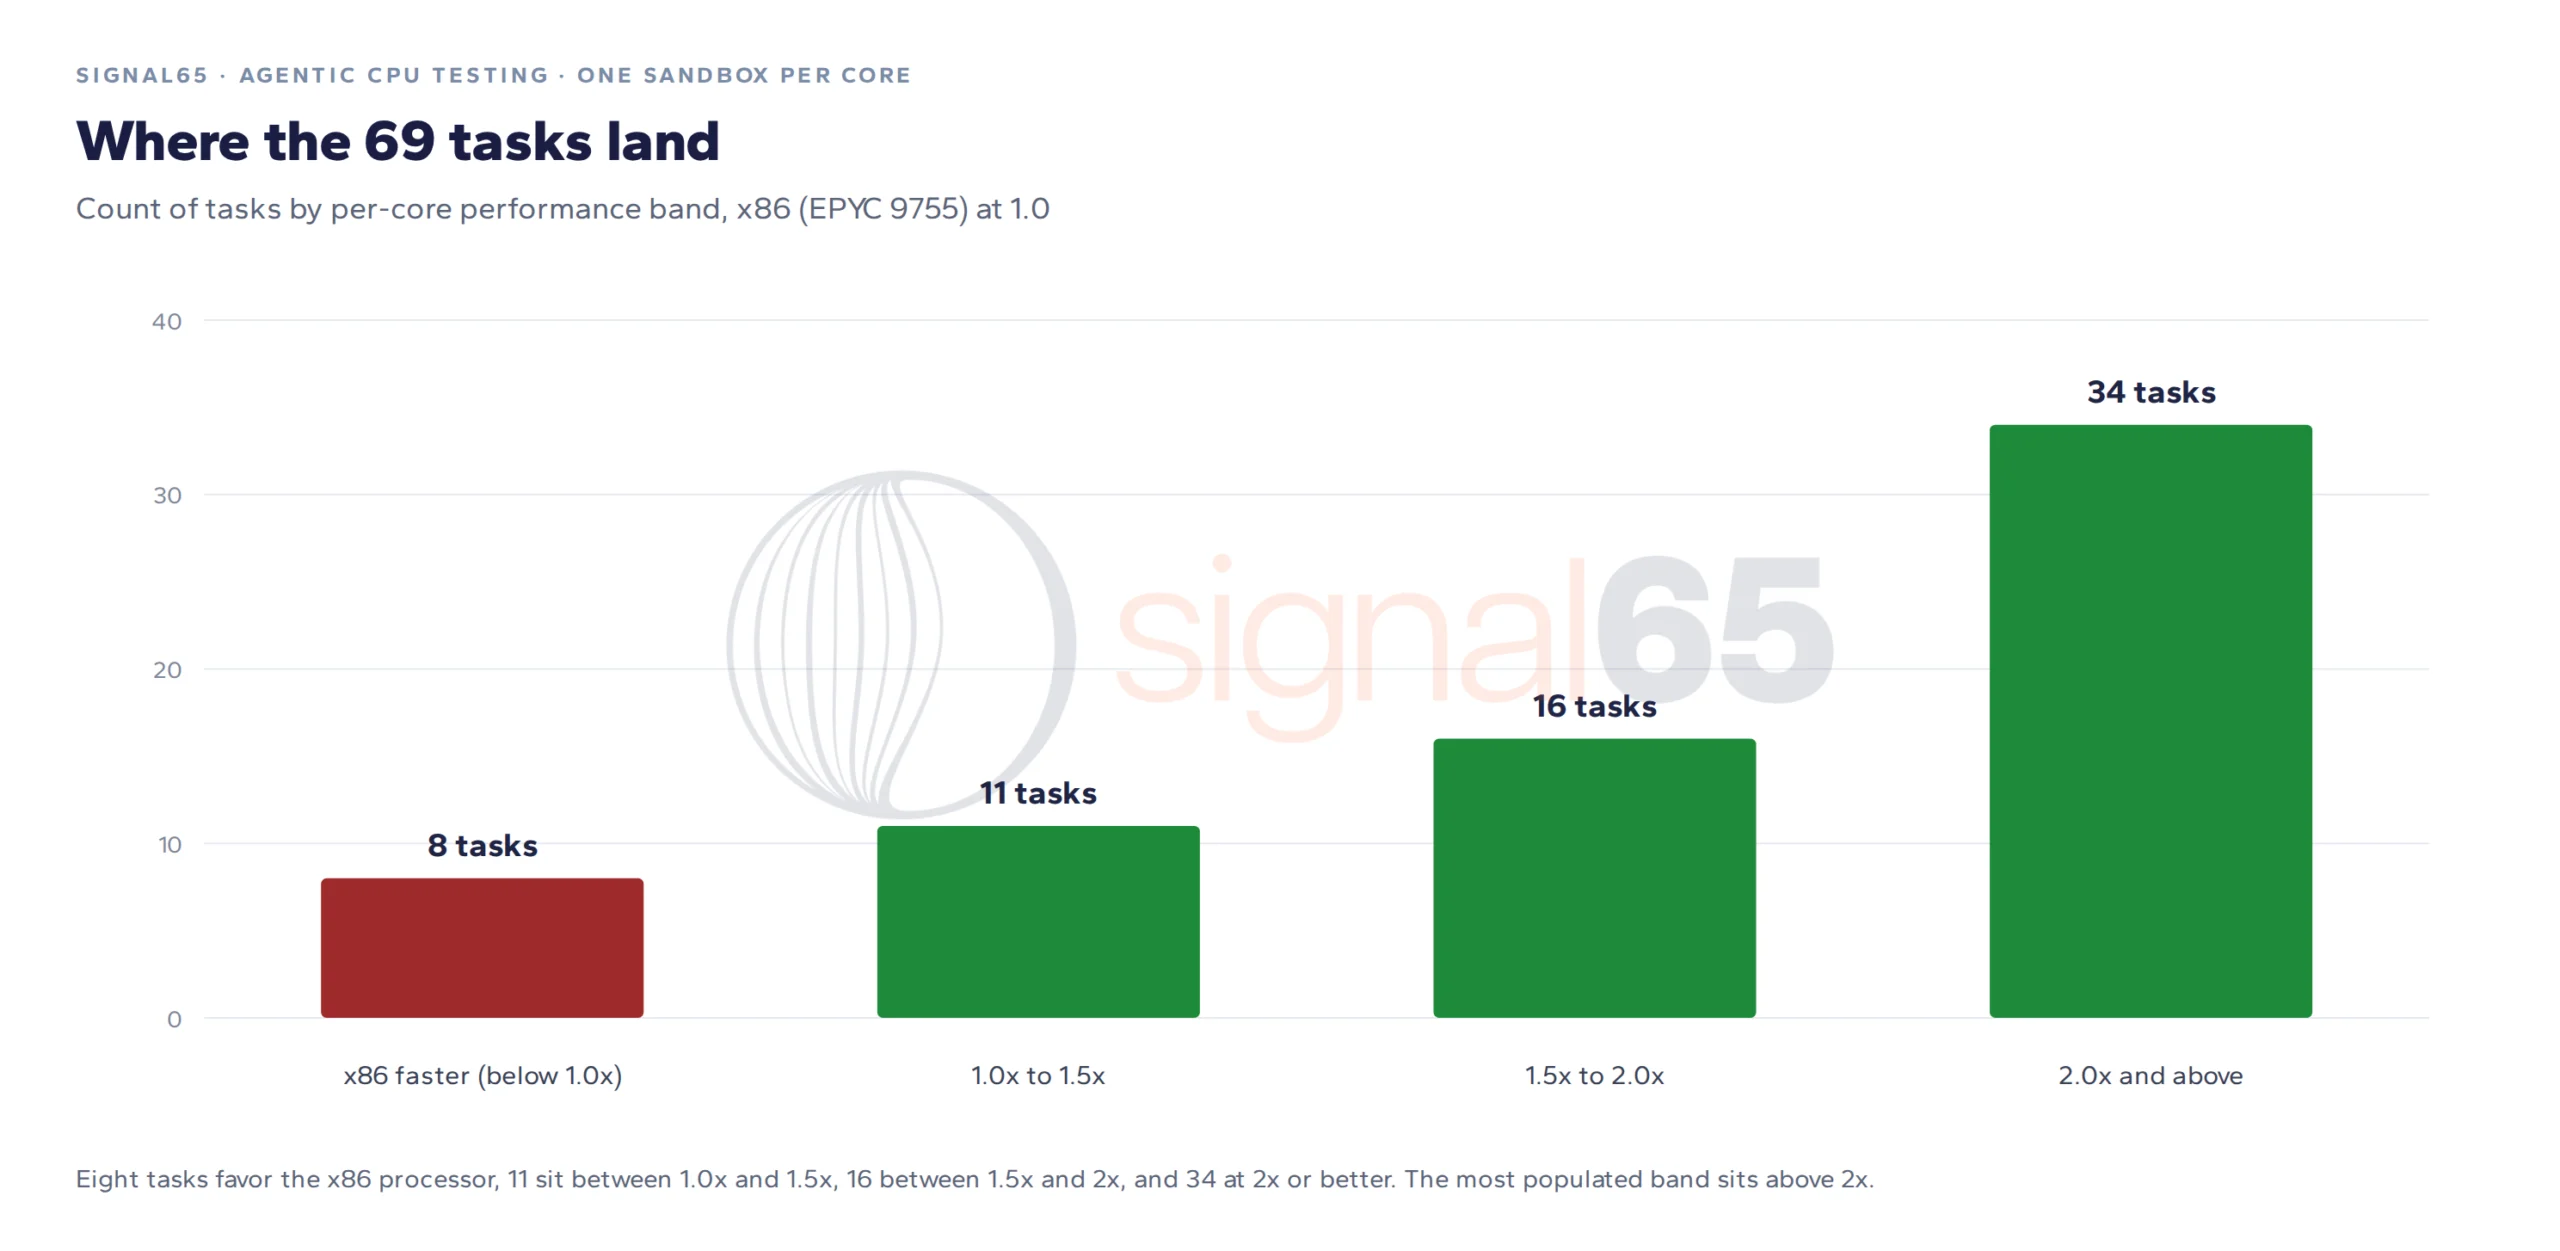
Figure 2. Count of the 69 matched tasks by per-core performance band.
Eight tasks fall below 1.0x (the x86 part is faster), 11 sit between 1.0x and 1.5x, 16 between 1.5x and 2x, and 34 at 2x or better, so Vera was faster on 61 of the 69 tasks.
A closer Look at the Most Agent-like Tasks
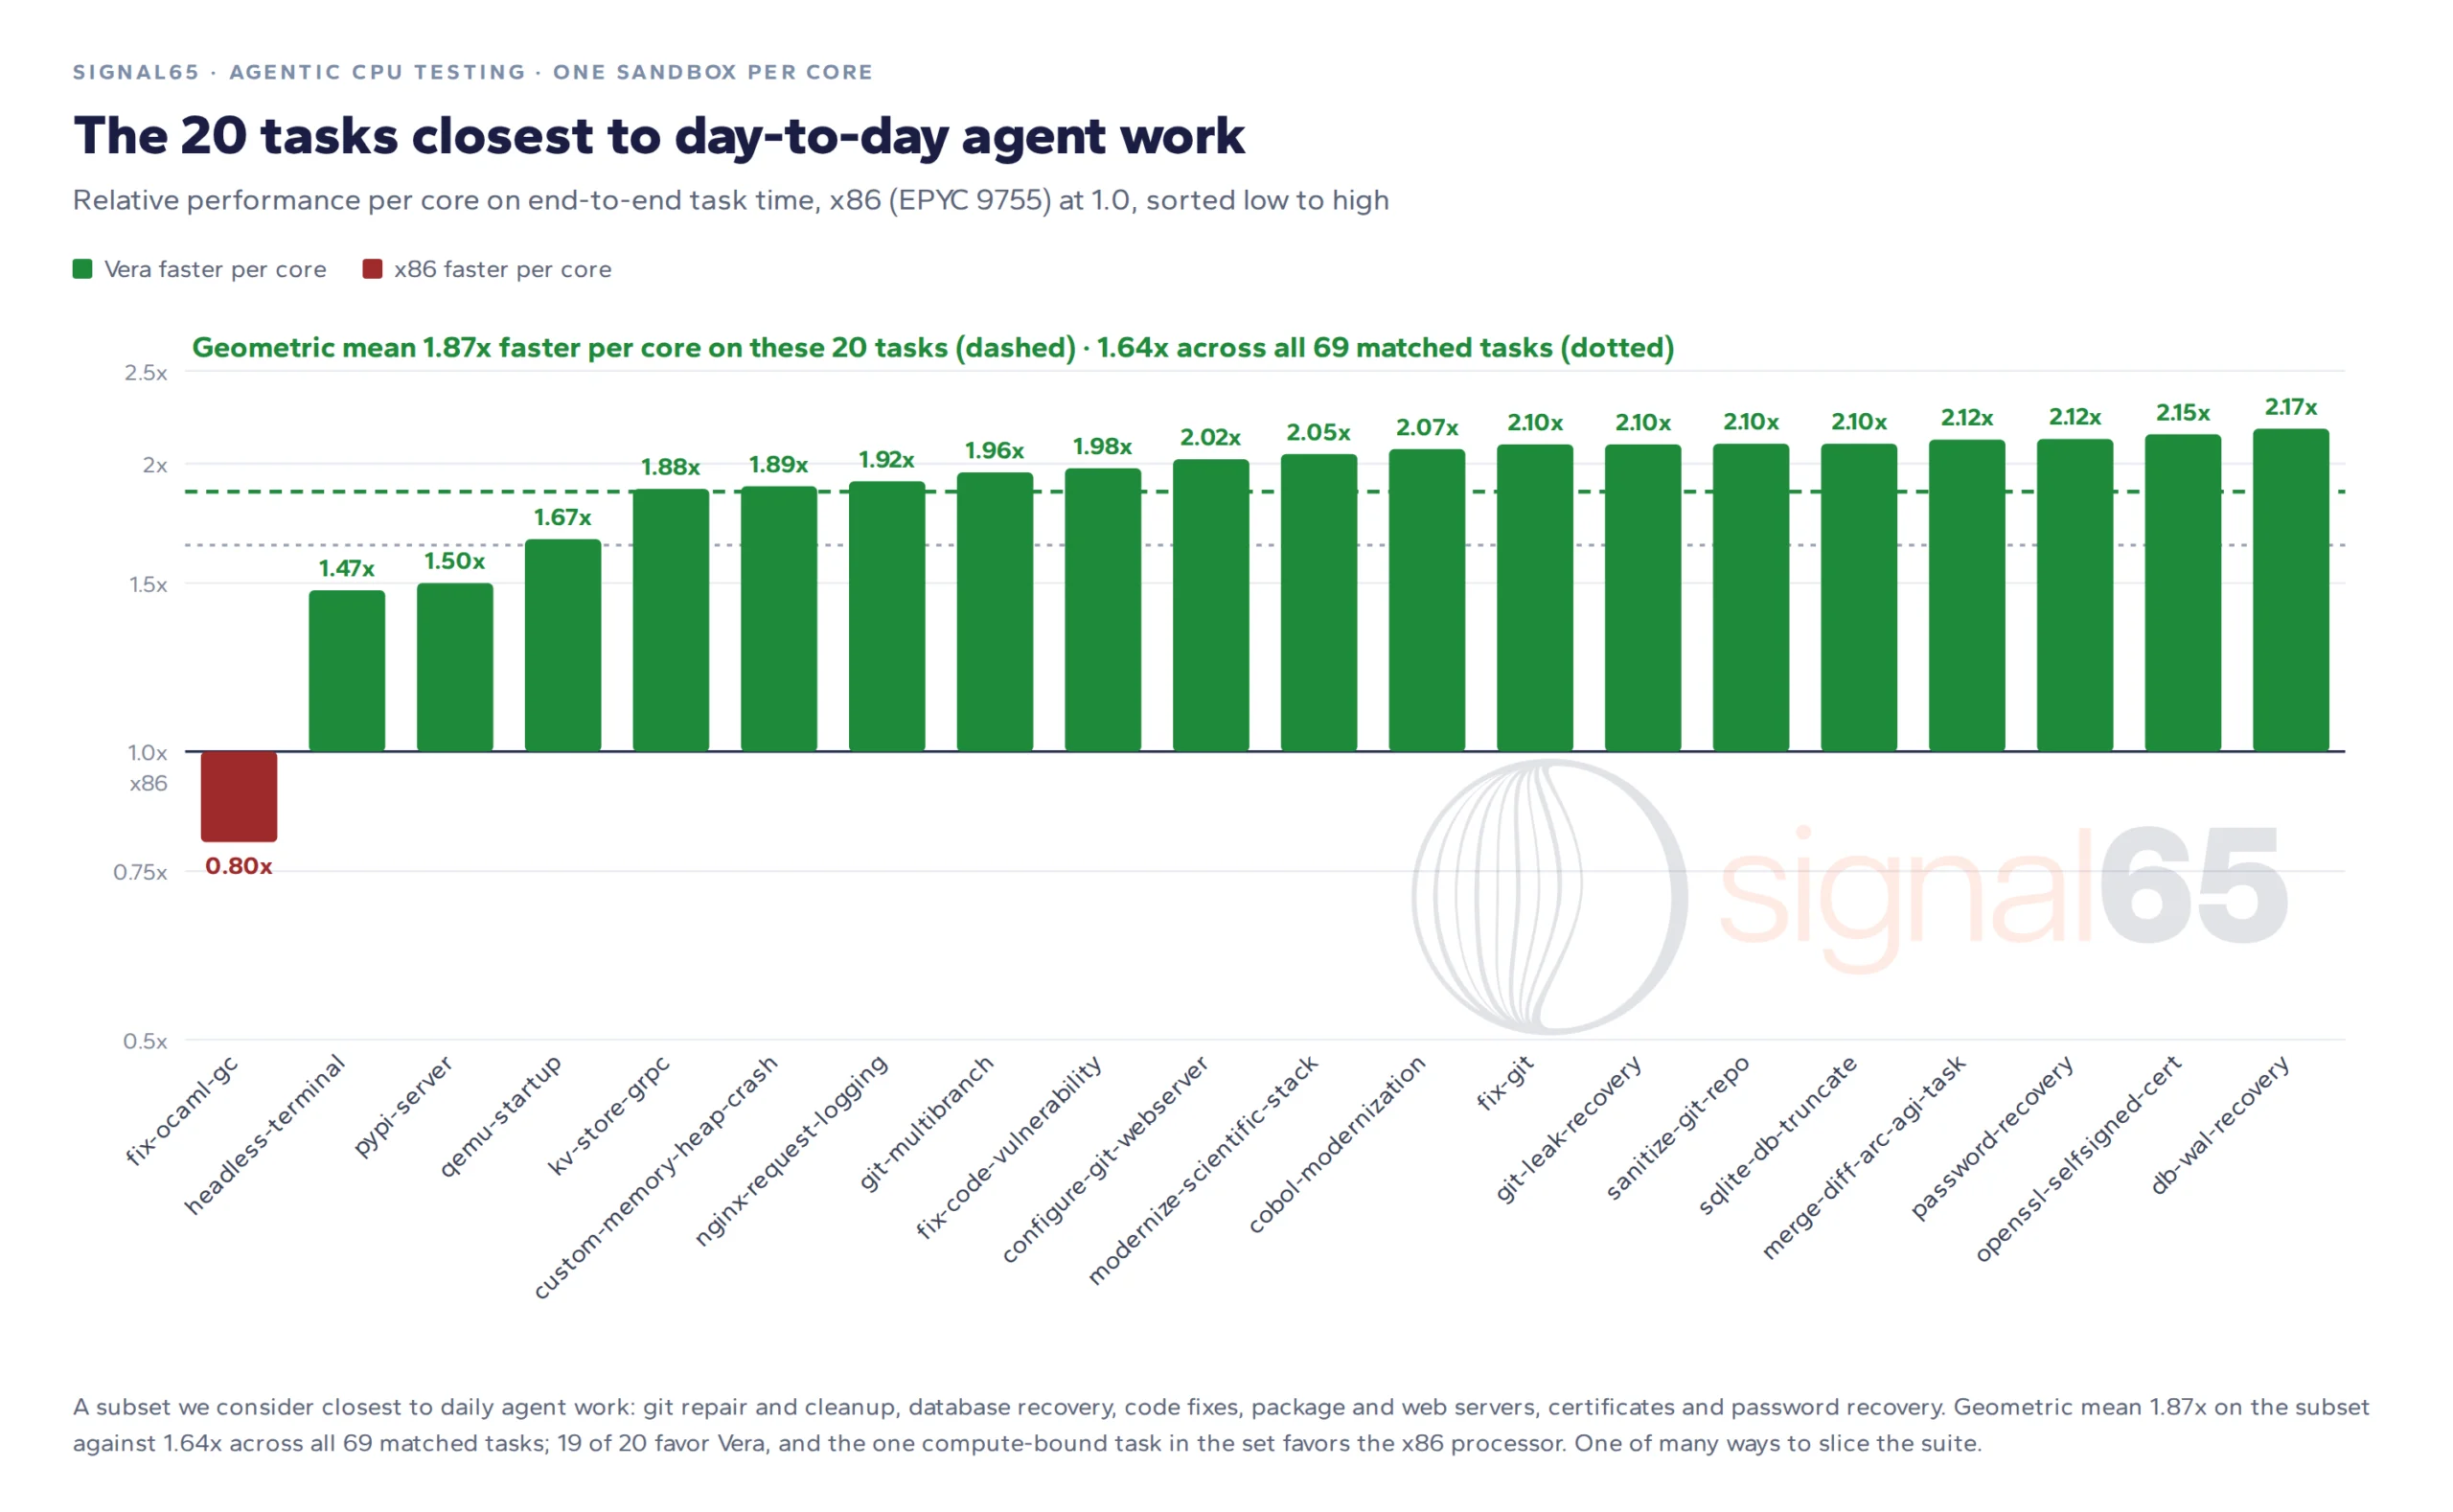
Figure 3. Per-core relative performance on the 20-task subset closest to day-to-day agent work.
The 89 tasks in the suite range from pure number-crunching to work that looks exactly like an agent closing out a ticket, and Vera appears to do well on the second kind specifically. We pulled out 20 tasks that in our view sit closest to day-to-day agent work, the kind of thing a coding or operations agent does dozens of times an hour like repairing and sanitizing git repositories, recovering a database, fixing a vulnerability in a codebase, standing up a package server or a web server, and more.
Every task in the subset requires multi-step tool use, interaction with a shell and a live environment, and code or systems reasoning rather than a single-shot answer, and the 20 group into six buckets that cover most of what a coding or operations agent does across a working day.
- Git and version control, repairing broken repositories, recovering from leaked secrets, and standing up a git server
- git-multibranch, fix-git, git-leak-recovery, sanitize-git-repo, configure-git-webserver
- Debugging and crash or state recovery, diagnosing a fault and restoring a system to a working state
- fix-ocaml-gc, custom-memory-heap-crash, db-wal-recovery
- Security and remediation, patching a vulnerability, issuing a certificate, and recovering credentials
- fix-code-vulnerability, openssl-selfsigned-cert, password-recovery
- Code modernization and migration, moving legacy code and aging dependencies onto current stacks
- cobol-modernization, modernize-scientific-stack
- Infrastructure and DevOps setup, bringing up package servers, virtual machines, and web server logging
- pypi-server, qemu-startup, nginx-request-logging
- Services, data layer, and abstract reasoning, building a service, repairing a database, and reasoning over structured problems
- kv-store-grpc, sqlite-db-truncate, merge-diff-arc-agi-task, headless-terminal
Together the six buckets span the full agent loop of reading a codebase, running tools in a shell, modifying state and verifying the result, which is why we consider the subset a compact stand-in for the broader suite. On those 20 tasks Vera’s per-core advantage is 1.87x, with 19 of the 20 favoring Vera and one, an OCaml garbage-collector fix that is closer to pure compute, favoring the x86 part.
There are many ways to slice a testing suite this size and obviously this view is just one of them, but we think it is a strong one. The subset leans toward shorter tasks where the sandbox lifecycle is a large share of the clock, and it leaves out the ML-flavored tasks that agents also run.
Vera Architecture and Agentic Workloads
Vera pairs 88 custom Arm cores, which NVIDIA calls Olympus, with 176 threads on TSMC 3nm. NVIDIA describes a 10-wide front end, 2 MB of private L2 per core and a 164 MB system-level cache shared across the socket. The larger private L2 cache may help when every core runs its own independent sandbox, but this test does not isolate its contribution to Vera’s result.
| NVIDIA Vera | x86 (AMD EPYC 9755) | |
|---|---|---|
| Cores / threads | 88 Olympus (Arm-compatible v9.2) / 176 | 128 Zen 5 / 256 |
| Process | TSMC 3nm | TSMC 4nm compute dies |
| L2 cache | 2 MB per core | 1 MB per core |
| Last-level cache | 164 MB system-level cache | 512 MB L3 |
| Memory | LPDDR5X on SOCAMM2, 8 controllers, up to 9,600 MT/s | DDR5, 12 channels, up to 6,400 MT/s |
| Memory bandwidth (socket) | About 1.2 TB/s | About 614 GB/s |
| Memory capacity (socket) | Up to 1.5 TB | Up to 6 TB |
| I/O | 96 lanes PCIe 6, CXL 3.1, 1.8 TB/s NVLink-C2C | 128 lanes PCIe 5, CXL 2.0 |
| TDP | 250 to 450 W configurable | 500 W (cTDP 320 to 500 W) |
Published specifications from NVIDIA and AMD. Bandwidth figures are theoretical peaks from the memory configuration; neither was measured in this study.
Memory is LPDDR5X on SOCAMM2 modules, and Vera’s published peak socket bandwidth is roughly twice the x86 figure in the table. Dividing those theoretical peaks by core count yields a larger per-core ratio still, but this study did not measure delivered bandwidth per core. Additional memory bandwidth may help when many sandboxes access memory at once, and we did not isolate bandwidth or contention in this test. NVIDIA quotes 30 to 40 W for Vera memory against 100 to 200 W for a DDR5 server memory configuration, and we did not verify those figures.
The rest of the platform, 1.8 TB/s NVLink-C2C for attaching Rubin GPUs, 96 lanes of PCIe 6 and CXL 3.1 at a 250 to 450 W configurable TDP, is context for a standalone CPU comparison. The system under test was a standalone two-socket Vera server with no GPUs attached, with all 88 sandboxes on one socket and the second socket idle. Vera also serves as the host CPU in Vera Rubin, and testing that system would show how these CPU results translate to workflows that include GPU inference. We did not measure power for Vera yet.
Conclusion and Next Steps
Agentic AI moves a large share of the wall clock to the CPU, and it moves it per session and per core, which is a determining factor in how many agents an agentic system can support. On that measure, Vera is a very significant contender in the market. It delivered 1.64x the per-core performance of a leading x86 processor across a broad set of agentic tasks, 1.87x on the tasks that look most like an agent’s daily work, and in Signal65’s own runs on the same hardware did slightly better than NVIDIA’s tested figures.
This study covers one workload family and one paired bare-metal comparison with the EPYC 9755, so it does not establish performance across other AMD, Intel or Arm processors, and that part is one of many in the AMD product family worth comparing against as the methodology matures. We have not evaluated whole-socket throughput, cost or memory-capacity tradeoffs, and we did not measure power.
Through the CPU portion of Signal65 PINNACLE we plan to test Vera in more depth, and we plan to run the same workloads on additional x86 processors under each vendor’s own configurations, building on the open discussions we have had with NVIDIA, AMD, Intel and others through the program.
Test Configuration
| Item | Detail |
|---|---|
| Benchmark | terminal-bench 2.0 at commit 2fd12b8, Harbor 0.22.0, oracle agent (reference solutions, no model inference). |
| Systems | NVIDIA Vera, standalone two-socket server with no GPUs attached, one socket under test (88 cores / 176 threads) with the second socket idle. AMD EPYC 9755, 128 cores / 256 threads, one socket. Bare metal in NVIDIA's lab. |
| Load | One sandbox per physical core, pinned to the core and its sibling thread, memory local to the socket. 88 sandboxes on Vera, 128 on the x86 processor. Each task run once per core. |
| Images | Task images pre-built and staged so runs make no network access. Per-container thread caps set. 2 vCPU quota per sandbox. |
| Metric | End-to-end task wall clock from sandbox creation to teardown, slowest copy per task. Ratio is x86 time divided by Vera time. Headline is the geometric mean over the 69 tasks that passed every copy on both systems, 1.64x; 1.63x on all 76 tasks in the comparison set. 13 of the 89 tasks were excluded, 11 not run and 2 at zero pass on both. |
| Signal65 runs | Vera, two configurations: NVIDIA's published run steps with self-built images, and NVIDIA's images with its full configuration. Same pass profile as NVIDIA's run; NVIDIA's task times fall between the two runs. |
| Not covered | Power (telemetry not reliable on the test systems), cloud instances, other x86 parts, per-socket or per-dollar comparisons, lifecycle decomposition. |