Today, Primate Labs is releasing Geekbench 7, the newest version of its cross-platform CPU and GPU benchmark. It is available now for Windows, macOS, Linux, Android, and iOS, and it brings both brand-new workloads and a new scoring methodology. To see what the update actually changes in practice, we ran Geekbench 7 alongside the outgoing Geekbench 6.7.1 on four of the most current laptop platforms from Qualcomm, Intel, AMD, and Apple.
What's New in Geekbench 7
Geekbench 7 is not just a simple refresh. Primate Labs has added workloads that reflect how people actually use their machines in 2026, and it has changed how the multi-core score is calculated. The headline changes on the CPU side:
New media workloads. A Video Encoder test encodes screen-sharing video with the AV1 codec, an Audio Encoder test compresses music and speech with Opus, and a Video Decoder workload decodes audio and video while generating live captions with the Whisper speech-recognition model. Together they model video conferencing, podcast apps, and captioned playback.
A Game Physics workload built on the Jolt physics engine used in shipping games, plus an expanded Photo Editor test and a Photo Library workload updated to handle modern formats such as JPEG XL and DNG.
A smarter multi-core benchmark. A workload now only runs multi-threaded if the real application it models is actually multi-threaded. The HTML5 Browser test, for example, is excluded from the multi-core suite because browsers in the real world are effectively single-threaded. The goal is a multi-core number that reflects real work rather than an inflated best case.
Larger, more demanding data sets across File Compression, PDF Viewer, and the image workloads, chosen to reflect the heavier files people work with today.
A refreshed GPU benchmark centered on machine learning and content-creation workloads such as face tracking, ML upscaling, background blur, path tracing, and fluid simulation. On the API side for this benchmark, CUDA joins OpenCL, Vulkan, and Metal as a supported API.
One structural change matters for interpreting everything that follows: Geekbench 7 is recalibrated against a new baseline of 2,500 points, now pegged to an AMD Ryzen 7 7700 desktop.
Combined with the tougher data sets, that means Geekbench 7 numbers sit lower than Geekbench 6 numbers for the same hardware, and the two versions’ scores are not directly comparable.
How We Tested
We tested four current-generation laptops, each representing a different CPU architecture:
Each system ran Geekbench 6.7.1 and Geekbench 7.0 in Windows Balanced power mode (or the macOS equivalent) on AC power, three runs averaged. We also captured battery (DC) and Best Performance runs, to take a look a power-scaling.
Geekbench 6 vs Geekbench 7
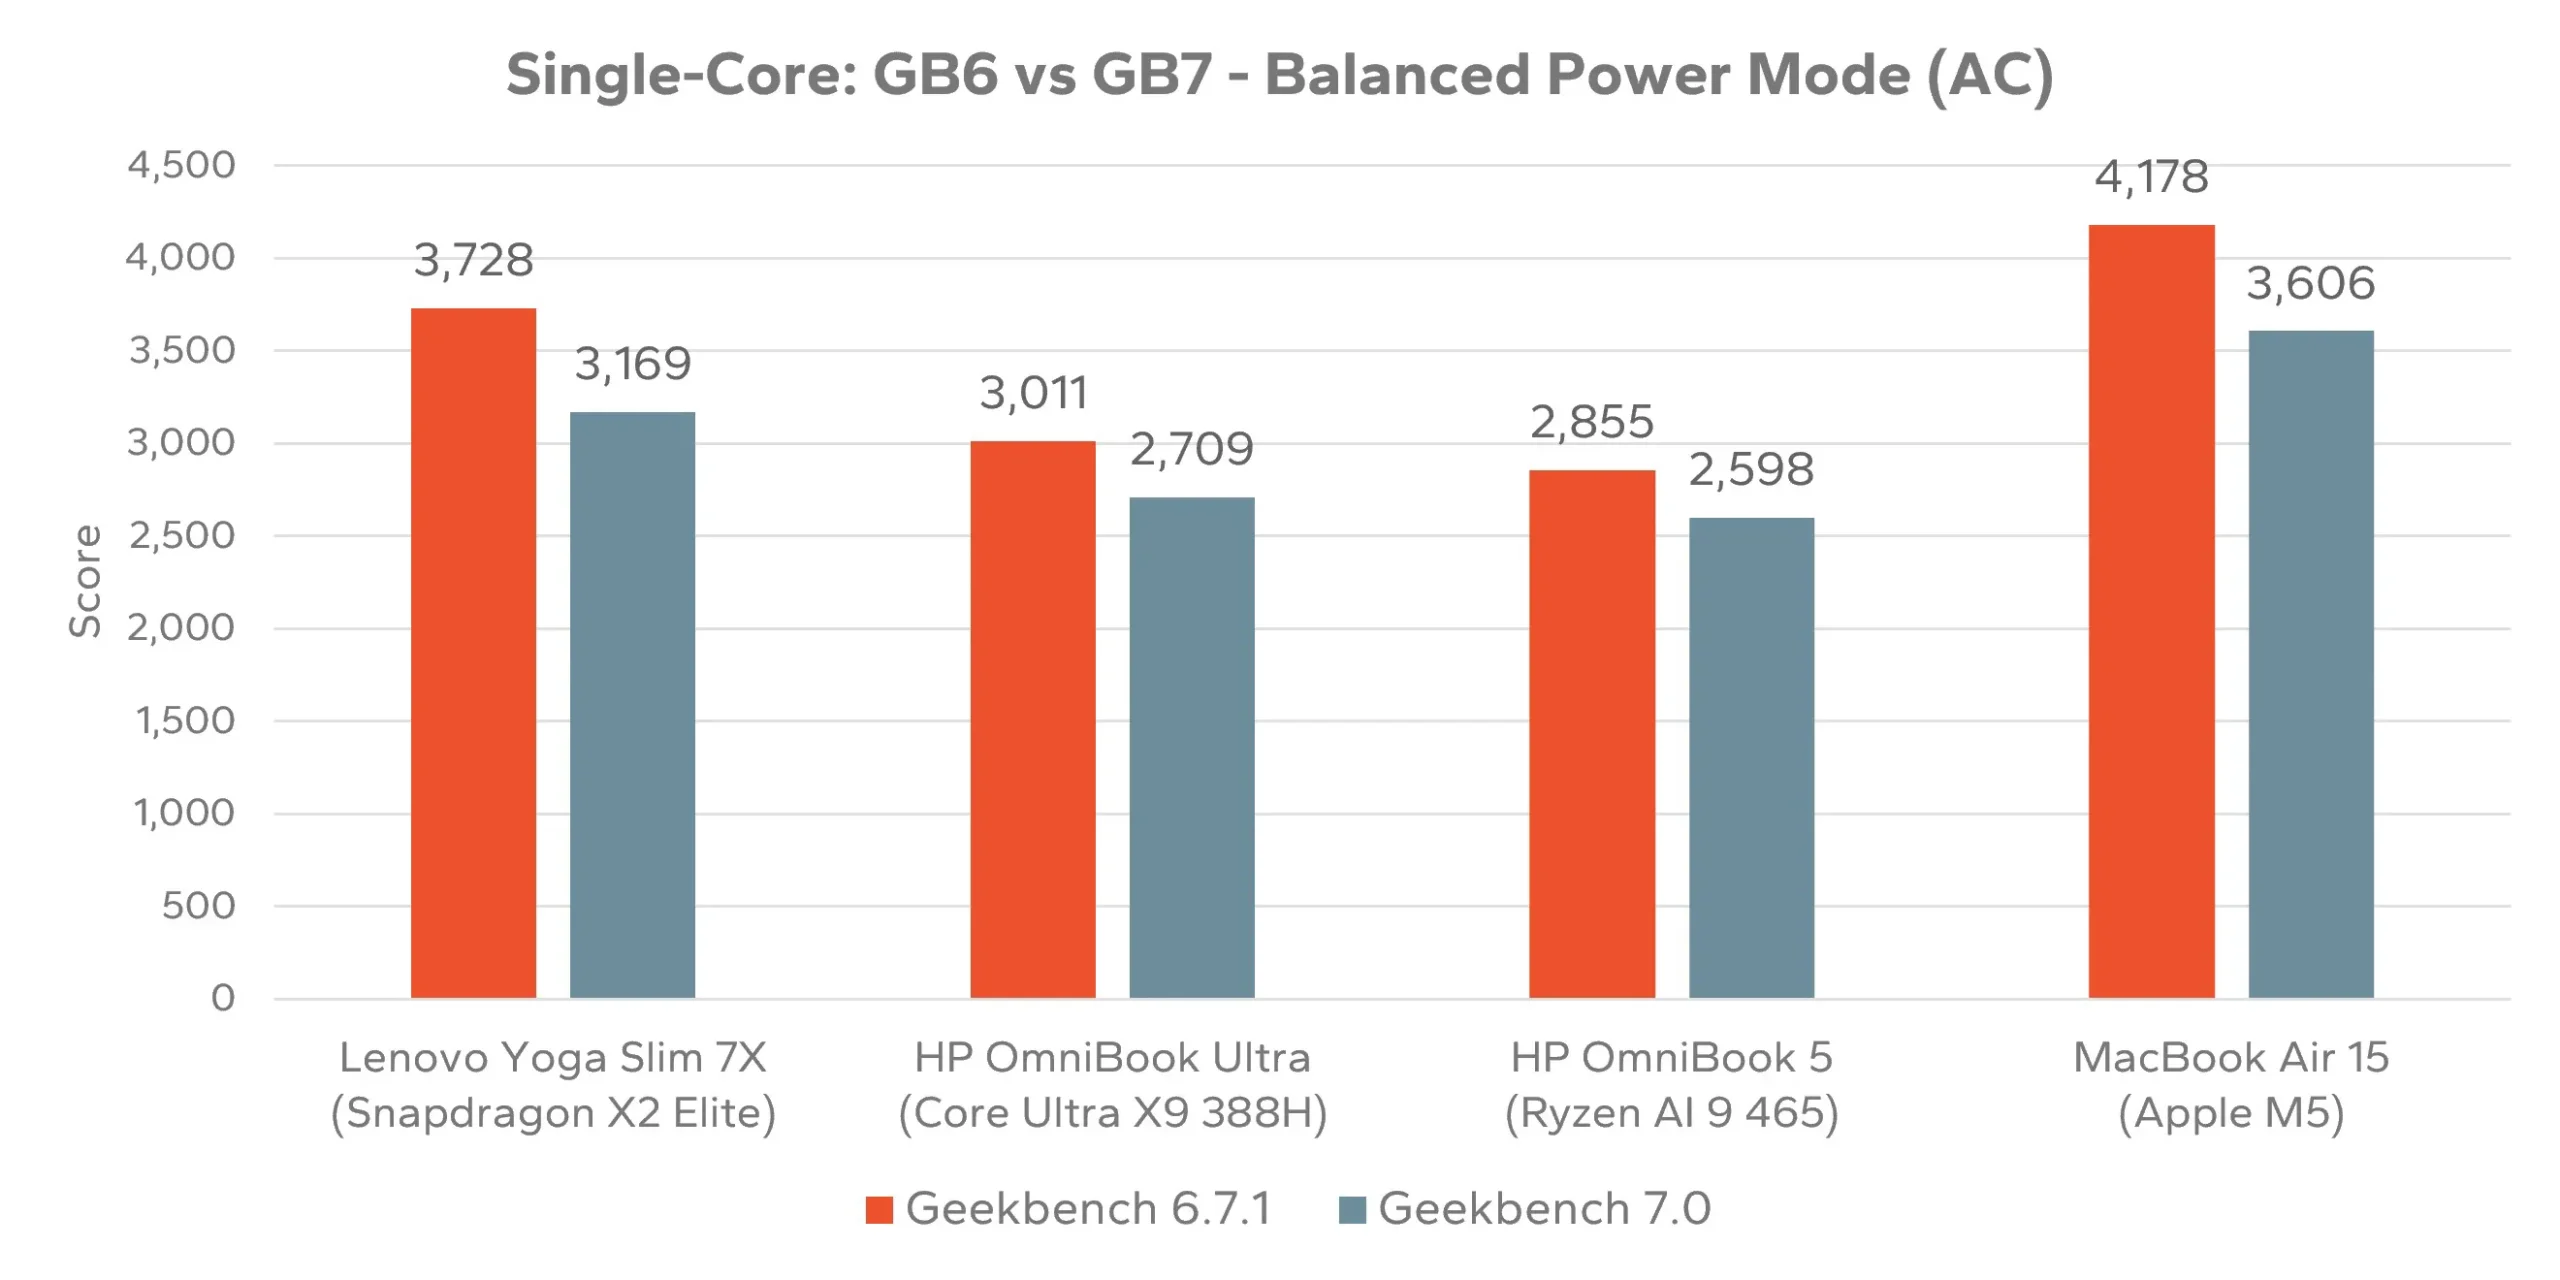
On single-core, every system scores lower under Geekbench 7 than under Geekbench 6, exactly as the recalibration and heavier data sets would predict. The declines are not uniform, though.
Single-Core: GB6 vs GB7 - Balanced Power Mode (AC)
The Snapdragon-based Lenovo drops the most (about 15%), the MacBook Air M5 falls roughly 14%, while the two x86 systems move less, Intel’s Panther Lake is down about 10% and AMD’s Ryzen AI 9 down about 9%.
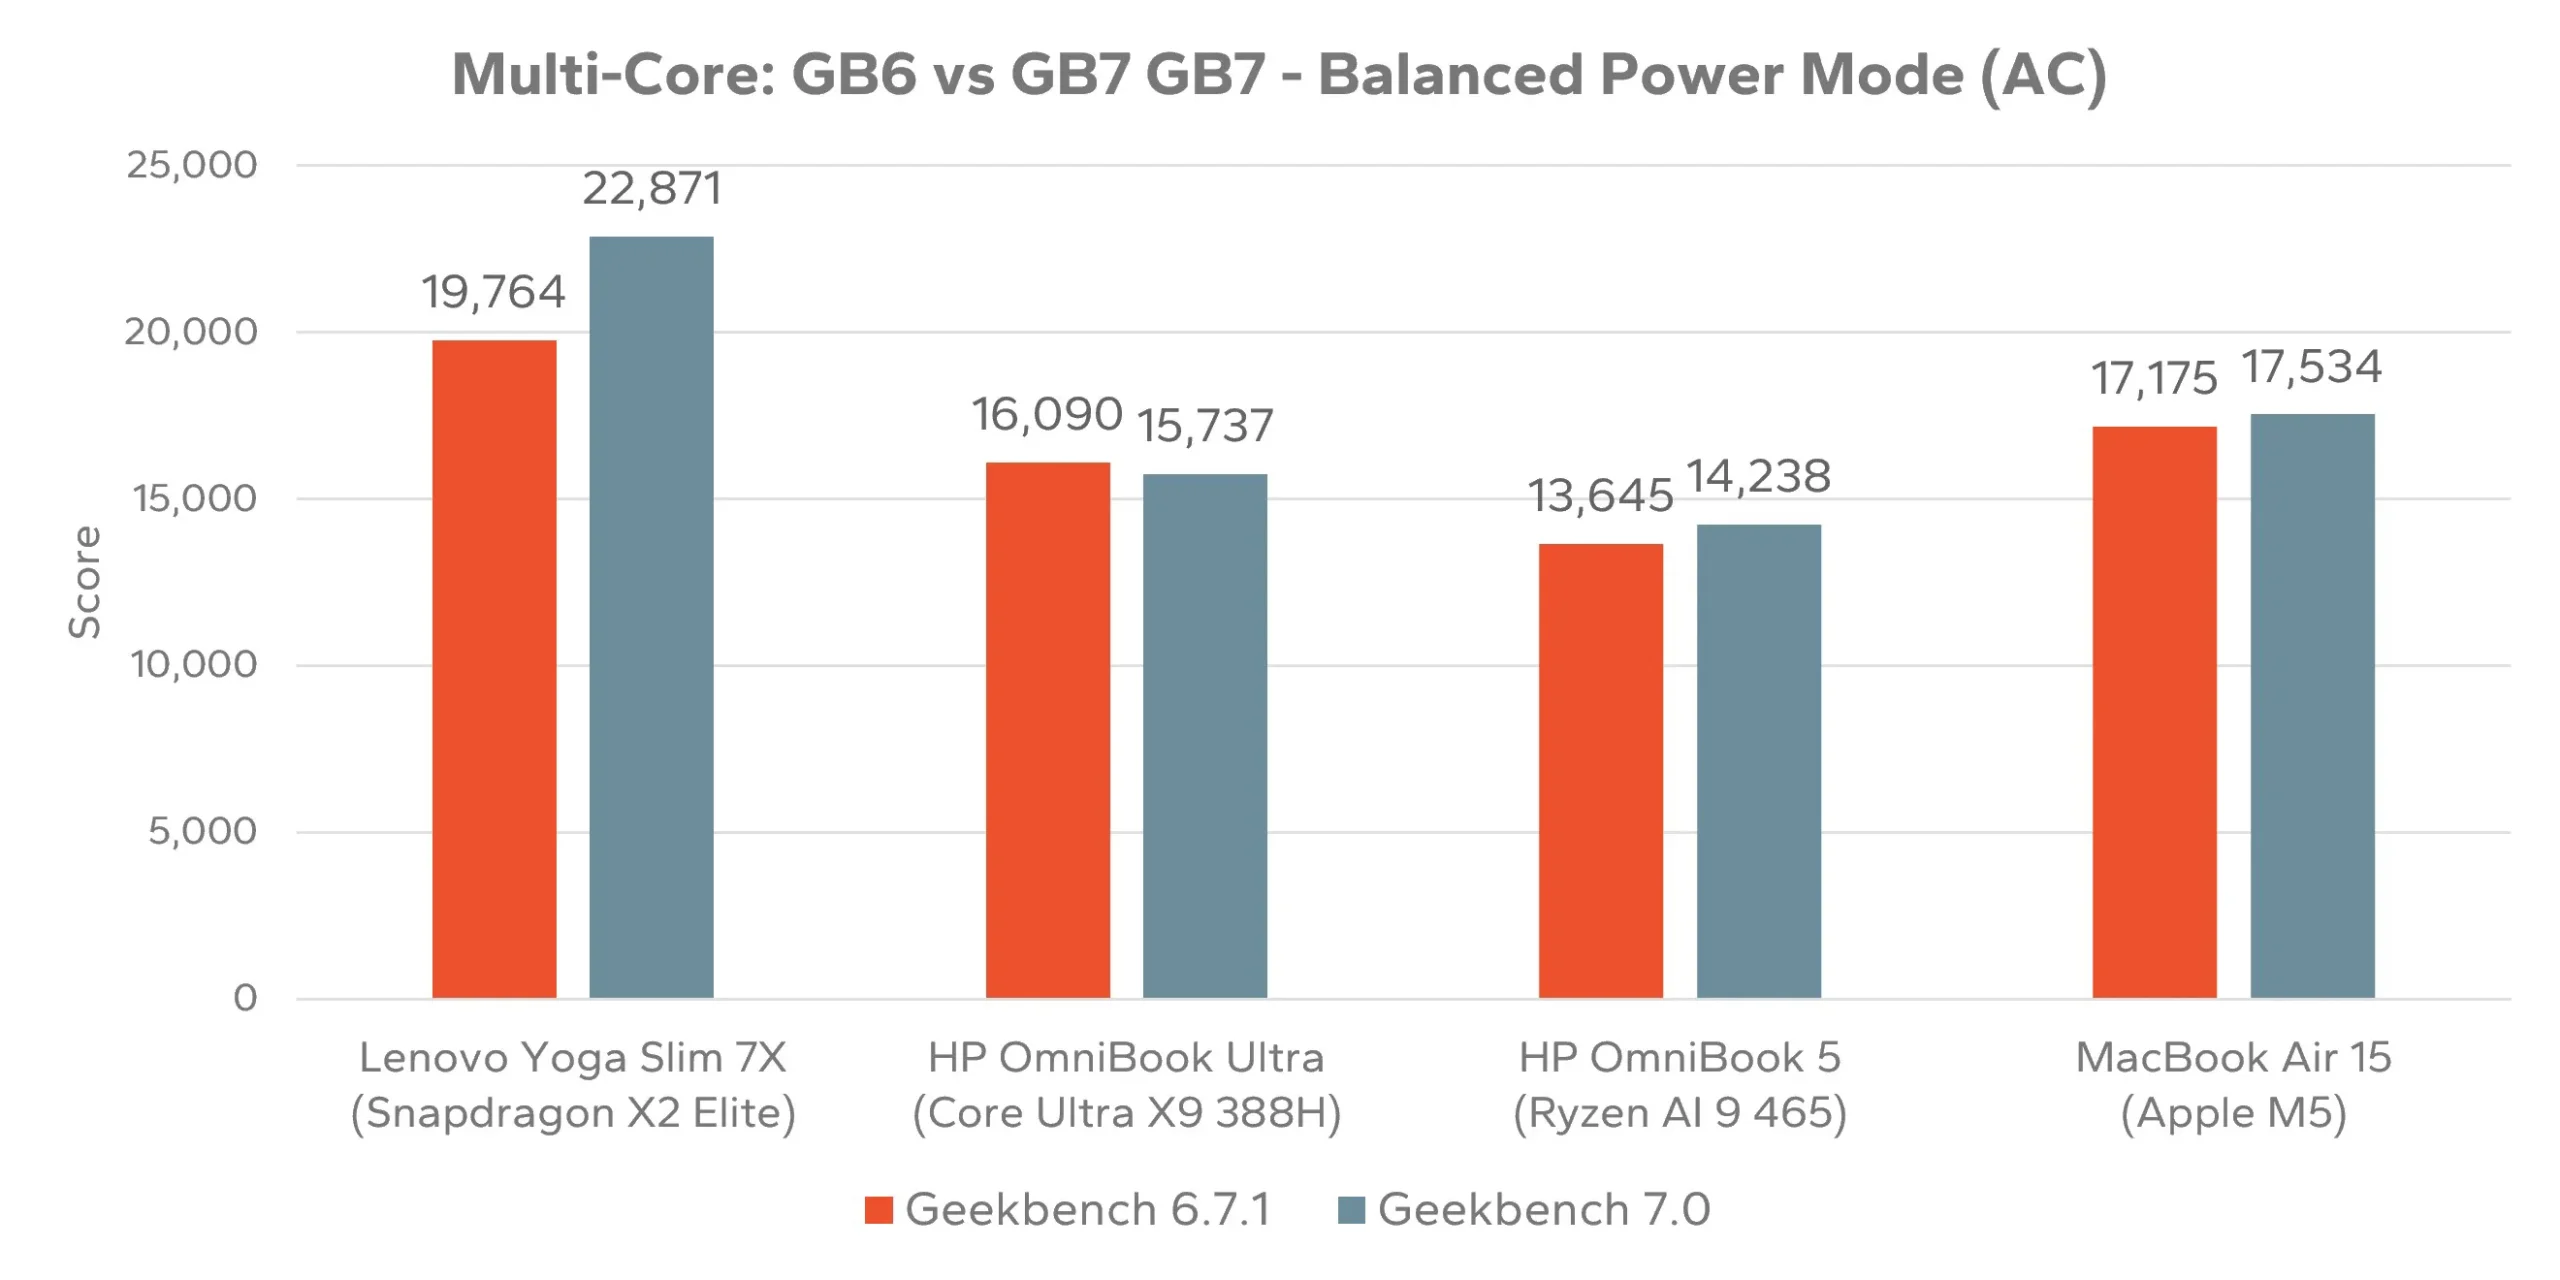
Multi-Core: GB6 vs GB7 GB7 - Balanced Power Mode (AC)
The multi-core picture is where the new methodology shows its teeth. The Lenovo Yoga Slim 7X and its12-core Snapdragon X2 Elite gains almost 16% moving to Geekbench 7, from 19,764 to 22,871. AMD’s Ryzen AI 9 rises about 4%. Apple’s M5 is essentially flat at 2%, while Intel’s Core Ultra X9 is the lone system to lose ground, slipping about 2%.
The +/- 2% results are more likely to be in the measurement noise category, but the gains on Qualcomm and AMD are more in the measurable zone.
This is a direct consequence of the redesigned multi-core benchmark. By dropping lightly-threaded tasks from the parallel suite and weighting the score toward workloads that genuinely scale across cores, Geekbench 7 rewards designs with more cores to feed. The Snapdragon X2 Elite, with the highest core count in this group, is the natural beneficiary and the shift from a roughly 12% single-core deficit against the MacBook to a commanding multi-core lead of nearly 30% is the sharpest illustration of how the new scoring methodology reshapes the standings.
Where the New Workloads Land
Breaking Geekbench 7 apart into its individual workloads shows where each platform’s strengths and weaknesses actually live.
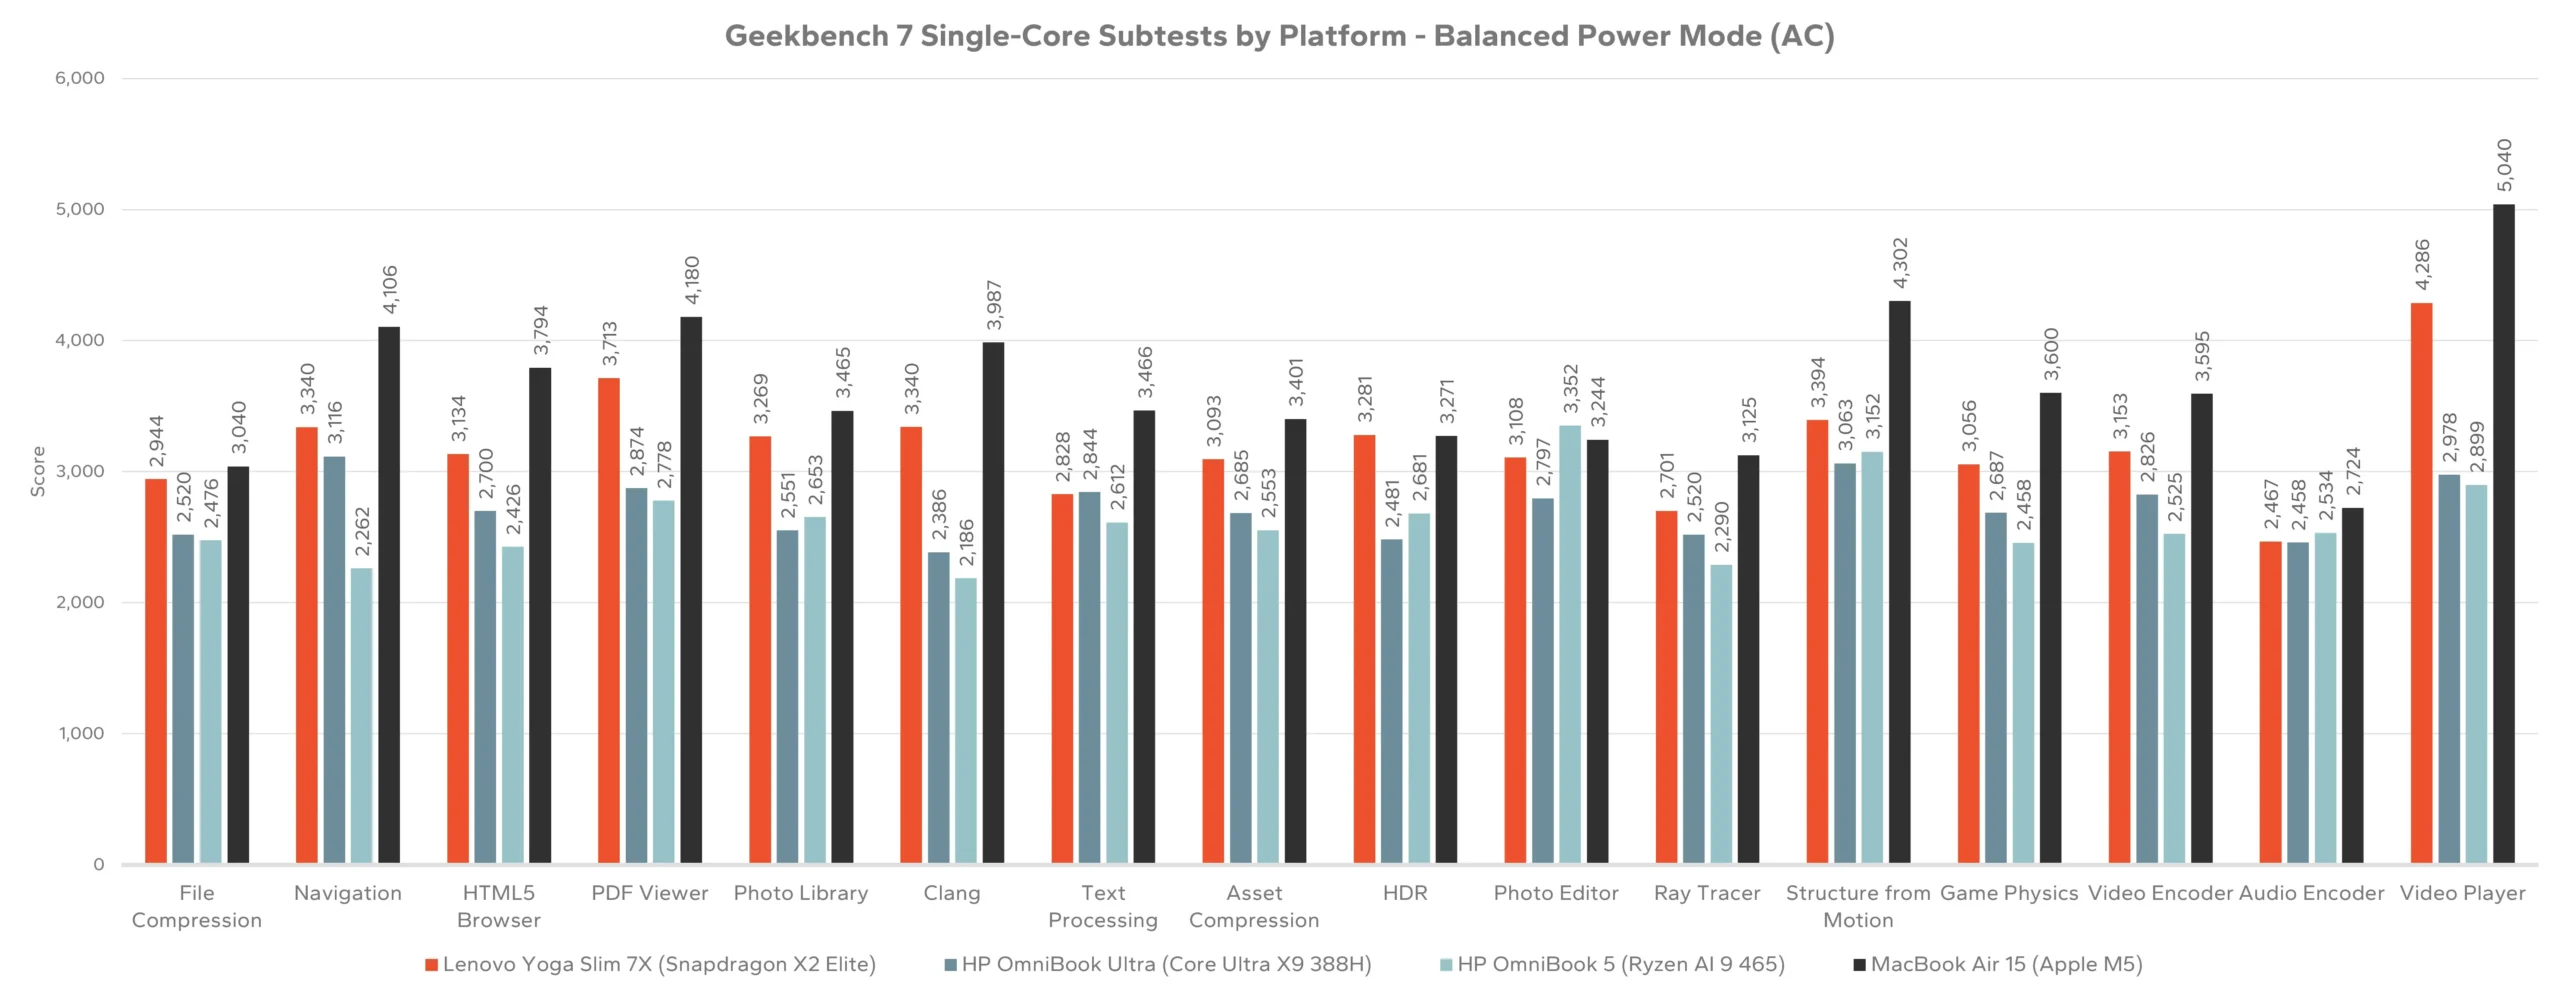
Geekbench 7 Single-Core Subtests by Platform - Balanced Power Mode (AC)
The MacBook Air’s M5 tops the majority of single-core workloads, with its largest margins in the workloads that lean on memory latency and media throughput. The clearest example is the new Video Decoder workload. In particular, the Whisper-plus-AV1 captioned-playback test that Geekbench 7 introduces has M5 posting 5,040 points while the Snapdragon X2 Elite follows at 4,286. Both are far ahead of the Intel (2,978) and AMD (2,899) systems.
The new Audio Encoder test (Opus compression) is the opposite case. Every one of the four platforms lands between roughly 2,460 and 2,720, causing the tightest clustering of any workload.
AMD’s Ryzen AI 9 465, which trails on most single-core tests, has one workload it owns outright, the expanded Photo Editor test, where its 3,352 is the highest of the four systems. It is a useful reminder that a single composite score hides real, workload-specific strengths.
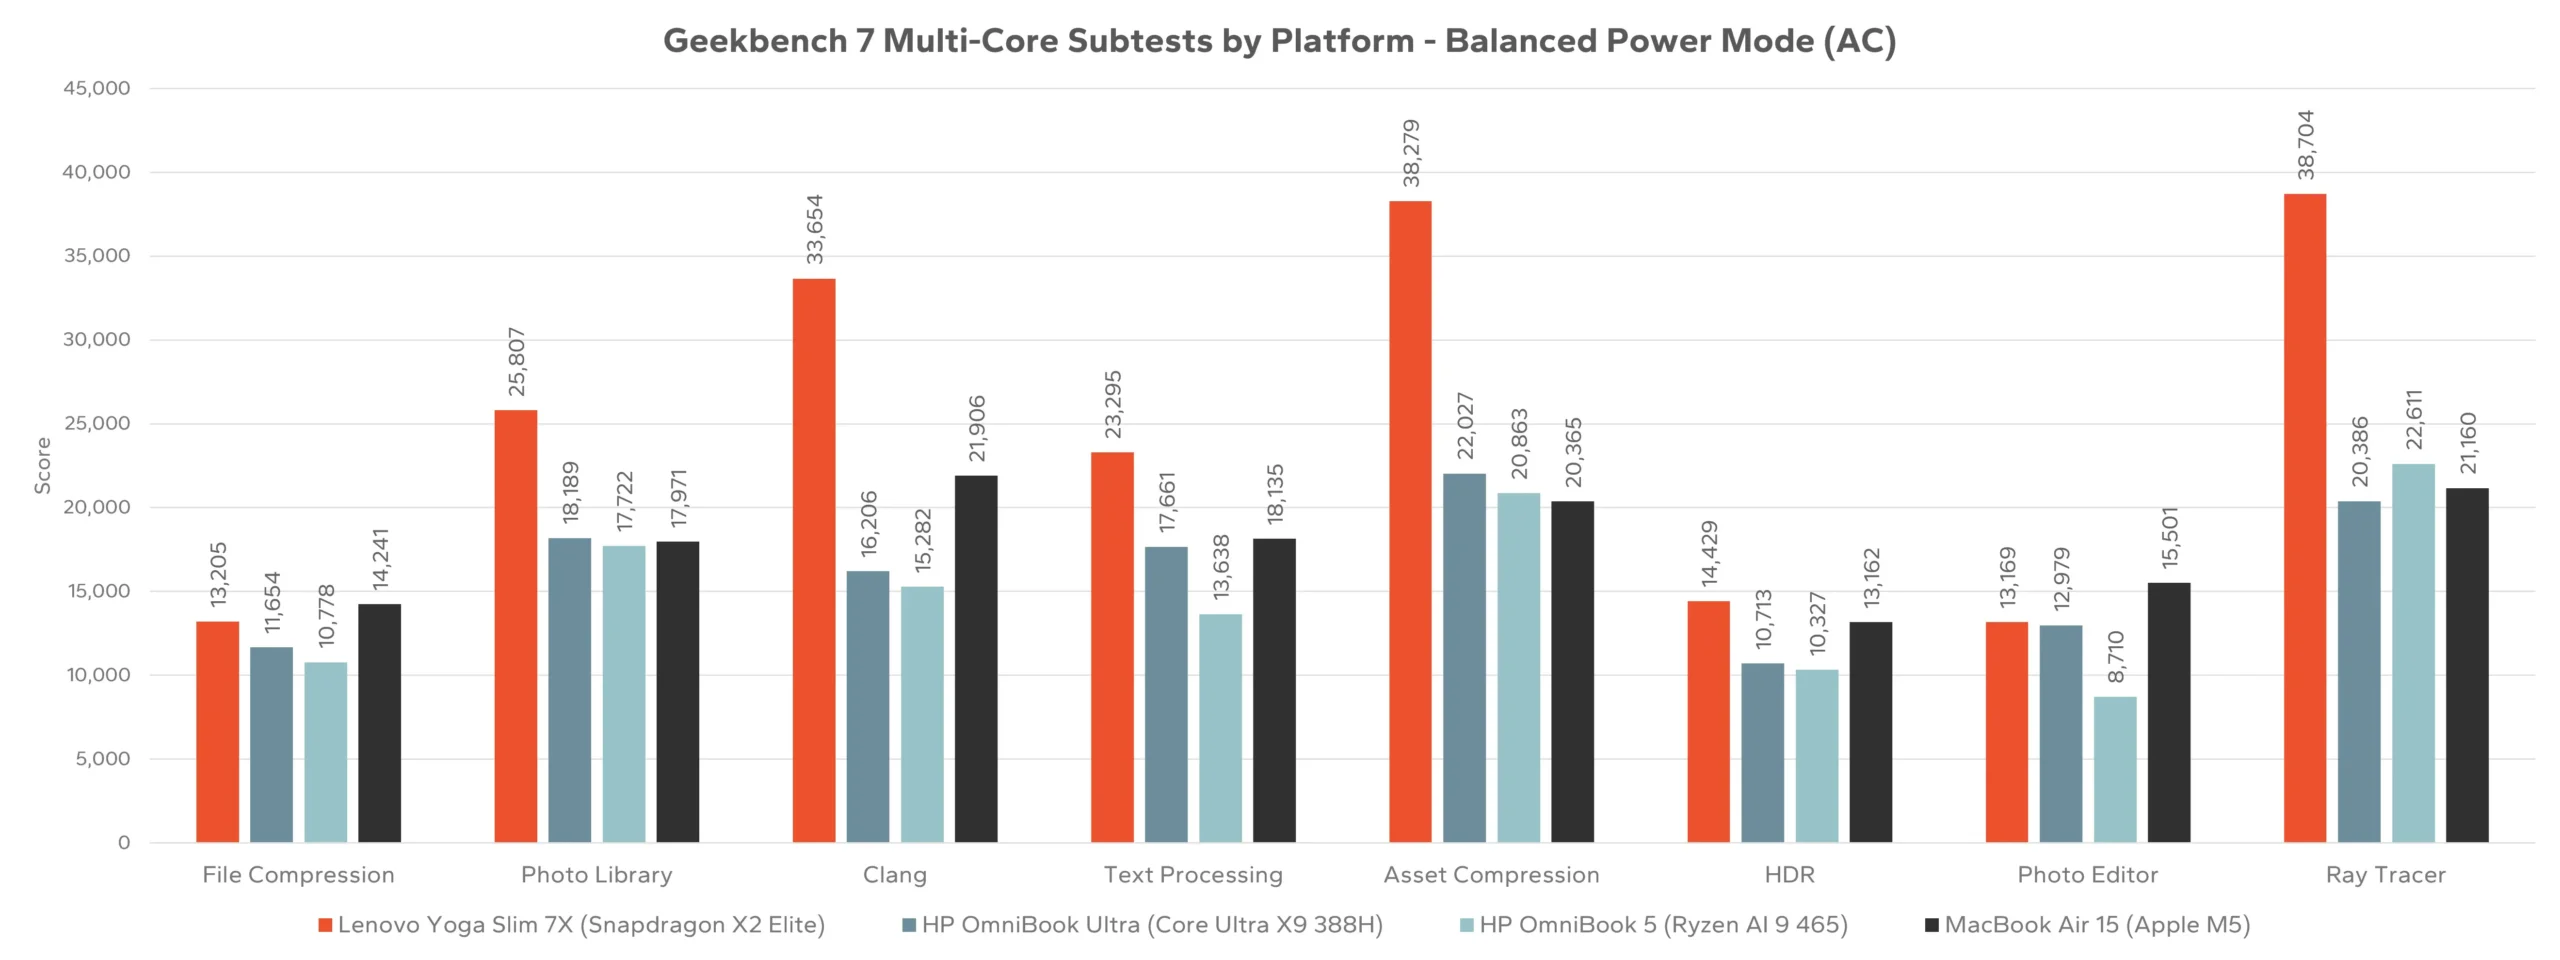
Geekbench 7 Multi-Core Subtests by Platform - Balanced Power Mode (AC)
The multi-core subscores make these conclusions clearer. With Geekbench 7 restricting multi-threading to workloads that truly parallelize, the Snapdragon X2 Elite pulls away in the heaviest of them, Ray Tracer (38,704), Asset Compression (38,279), and Clang (33,654). These are precisely the parallel tasks where more cores translate directly into more throughput, and they explain why the Snapdragon’s overall multi-core score jumped the way it did.
Performance on Battery
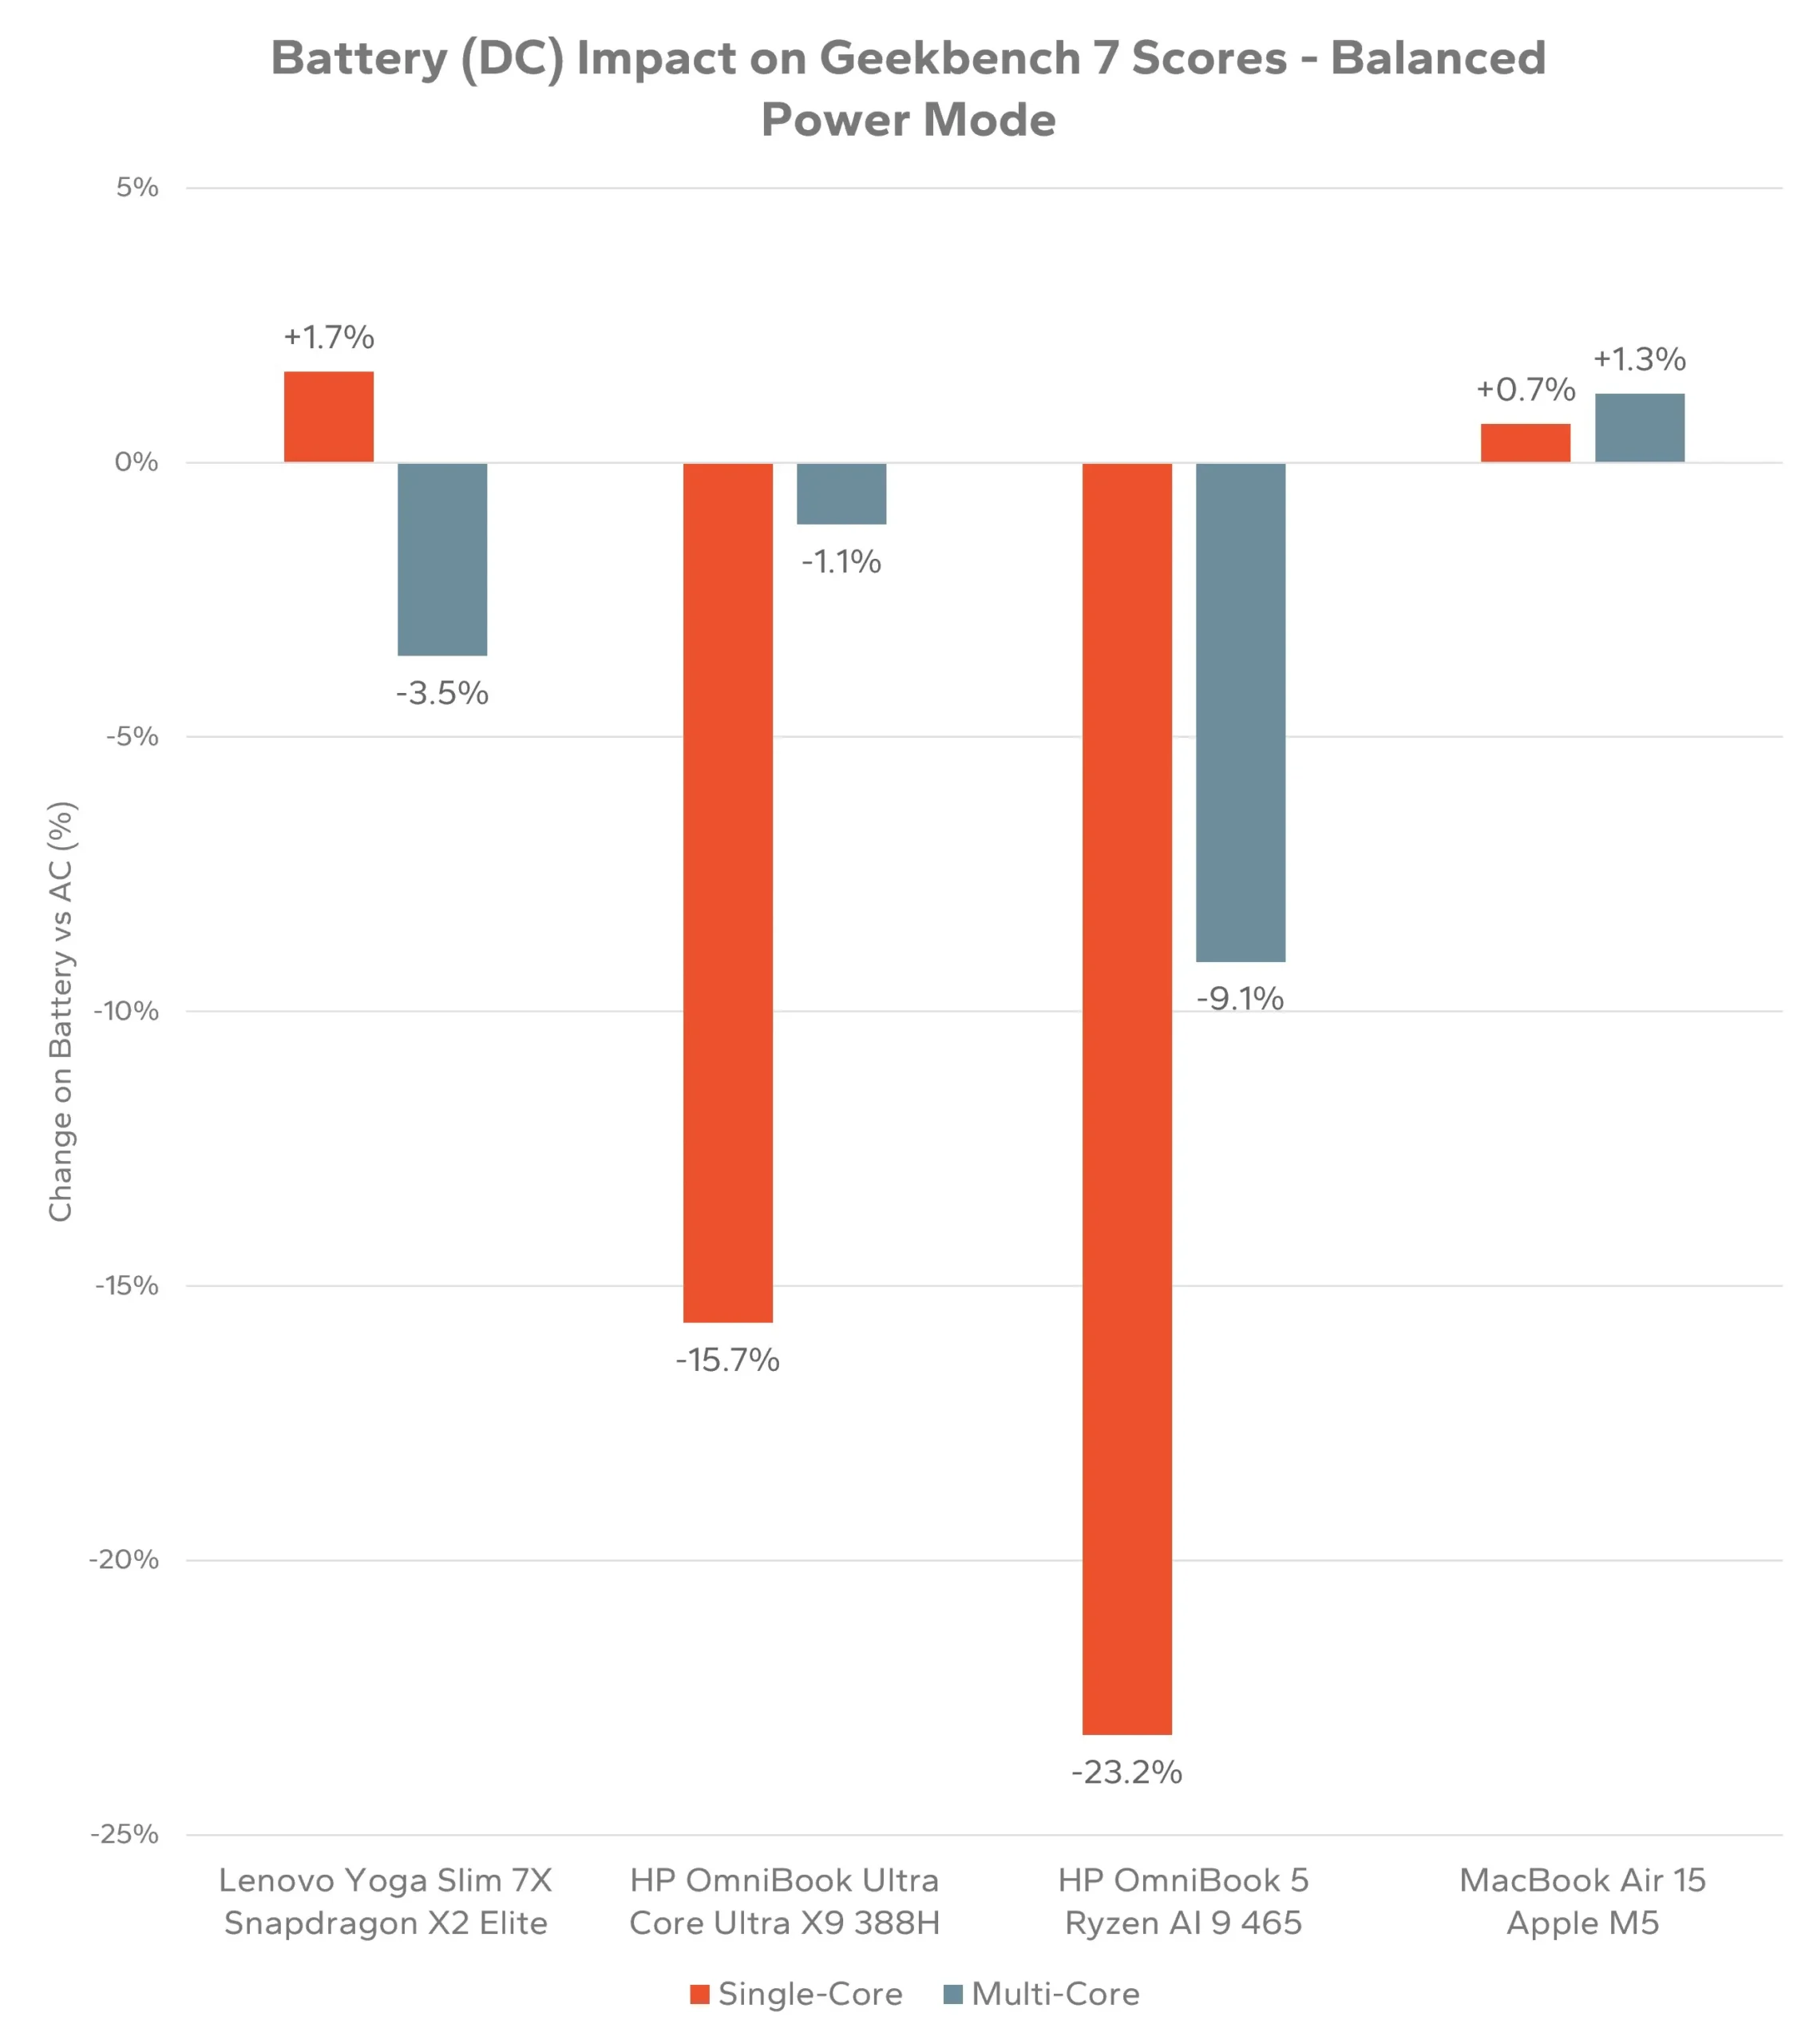
Benchmarks on AC power only tell half the story for a laptop. Comparing Balanced-mode Geekbench 7 scores on battery against the same runs on AC reveals a sharp architectural divide.
Battery (DC) Impact on Geekbench 7 Scores - Balanced Power Mode
The Arm-based systems barely flinch when unplugged. The Snapdragon-powered Lenovo actually posts a slightly higher single-core score on battery (+1.7%), and the MacBook Air M5 is effectively unchanged (+0.7% single-core, +1.3% multi-core).
The x86 systems tell a different story. Intel’s Core Ultra X9 gives up nearly 16% of its single-core performance on battery, and AMD’s Ryzen AI 9 sheds a substantial 23% single-core and about 9% multi-core. For buyers who spend real time away from a charger, that consistency gap is arguably as important as peak plugged-in performance.
Early Takeaways
Geekbench 7 is a meaningful step rather than a cosmetic update. The rebuilt multi-core methodology changes which chip architectures look strong, favoring higher core counts on genuinely parallel work, and the new media and simulation workloads surface differences between platforms that Geekbench 6 simply did not measure.
Keep in mind that with a sample size of one platform per CPU, the trends we saw here with results aren’t necessarily indicative of architectural performance differences, but they can be taken as a preview with further exploration to come.
As with any single benchmark, these numbers cannot tell the whole story of system-level performance. But the first data is already telling. While the Snapdragon X2 Elite is the standout beneficiary of Geekbench 7’s multi-core redesign, Apple’s M5 remains the single-core leader, and the Arm platforms’ ability to hold performance on battery is one of the clearest divides in the results.